Management Areas
What you’ll learn
Section titled “What you’ll learn”- What management areas are and why a population would care
- How layers let you carry multiple independent zoning schemes side-by-side
- How areas and sub-areas nest to give you both a wide and a fine-grained view
- How encounters are auto-assigned to areas and where that assignment shows up
What is a management area?
Section titled “What is a management area?”A management area is a named, polygon-bounded zone within a population’s study range. Examples:
- A DFO Pacific Fisheries Management Area (PFMA) — e.g. Area 28 (Strait of Georgia North) and its subareas 28-1, 28-2, etc.
- A NOAA stock assessment region.
- An internal study area you’ve defined for a multi-year comparison.
- A custom zone for a specific transect, marine protected area, or research grant boundary.
When an encounter has GPS coordinates, finwave checks every active management-area polygon and stamps the encounter with the smallest one that contains it — for each layer you’ve defined. So a single encounter in the Strait of Georgia could simultaneously be tagged with DFO PFMA 28-1 and Internal Study Zone 7 if both layers cover that point.
Why bother?
Section titled “Why bother?”- Filter encounters by zone. “Show me everything in PFMA 28 in 2024.”
- Compare across regulatory regimes. Two layers (DFO + your internal zoning) lit up at once — see where they agree and where they diverge.
- Hand reports to managers in their language. A fisheries manager wants results scoped to their area numbers; a researcher wants them scoped to a study zone. Both are now first-class.
- Tag once, query forever. Encounters created tomorrow are auto-stamped on submission. Encounters in your existing catalog get re-stamped when you import or edit a layer’s polygons.
The four moving parts
Section titled “The four moving parts”| Concept | What it is |
|---|---|
| Layer | A versioned set of zones from a single source — “DFO Pacific Fisheries Management Areas 2024”, “Internal Study Areas”. Multiple layers can be active in a population at once and may overlap. |
| Area | One polygon inside a layer. Areas have a stable Code (e.g. 28, PFMA-19) and a display name. |
| Sub-area | An area whose parent area is another area in the same layer. The parent’s polygon contains the child’s; the child wins assignment when an encounter falls in both. |
| Encounter overlay | When you open an encounter, the location map shows one polygon for each active layer it falls inside (in the layer’s color). |
What can I do?
Section titled “What can I do?”- Browse and toggle layers in your population — control which contribute to encounter assignment and which render on the encounter map.
- Import a layer from a GeoJSON file — pull in DFO PFMAs from BC Data Catalogue, or NOAA stocks, or a colleague’s shapefile.
- Draw your own polygons on a map — click points to define a custom zone.
- Edit existing polygons by dragging vertices.
- See all your layers stacked at once in the Overlap Viewer to sanity-check that boundaries align.
Read on:
- Concepts — layers, sub-area hierarchy, assignment rules in detail
- Getting source data — where to find GeoJSON for DFO, NOAA, and other public datasets
- Importing — walking through the Import dialog and property mappings
- Drawing & editing — creating zones from scratch on the map
- Troubleshooting — when things don’t behave as expected
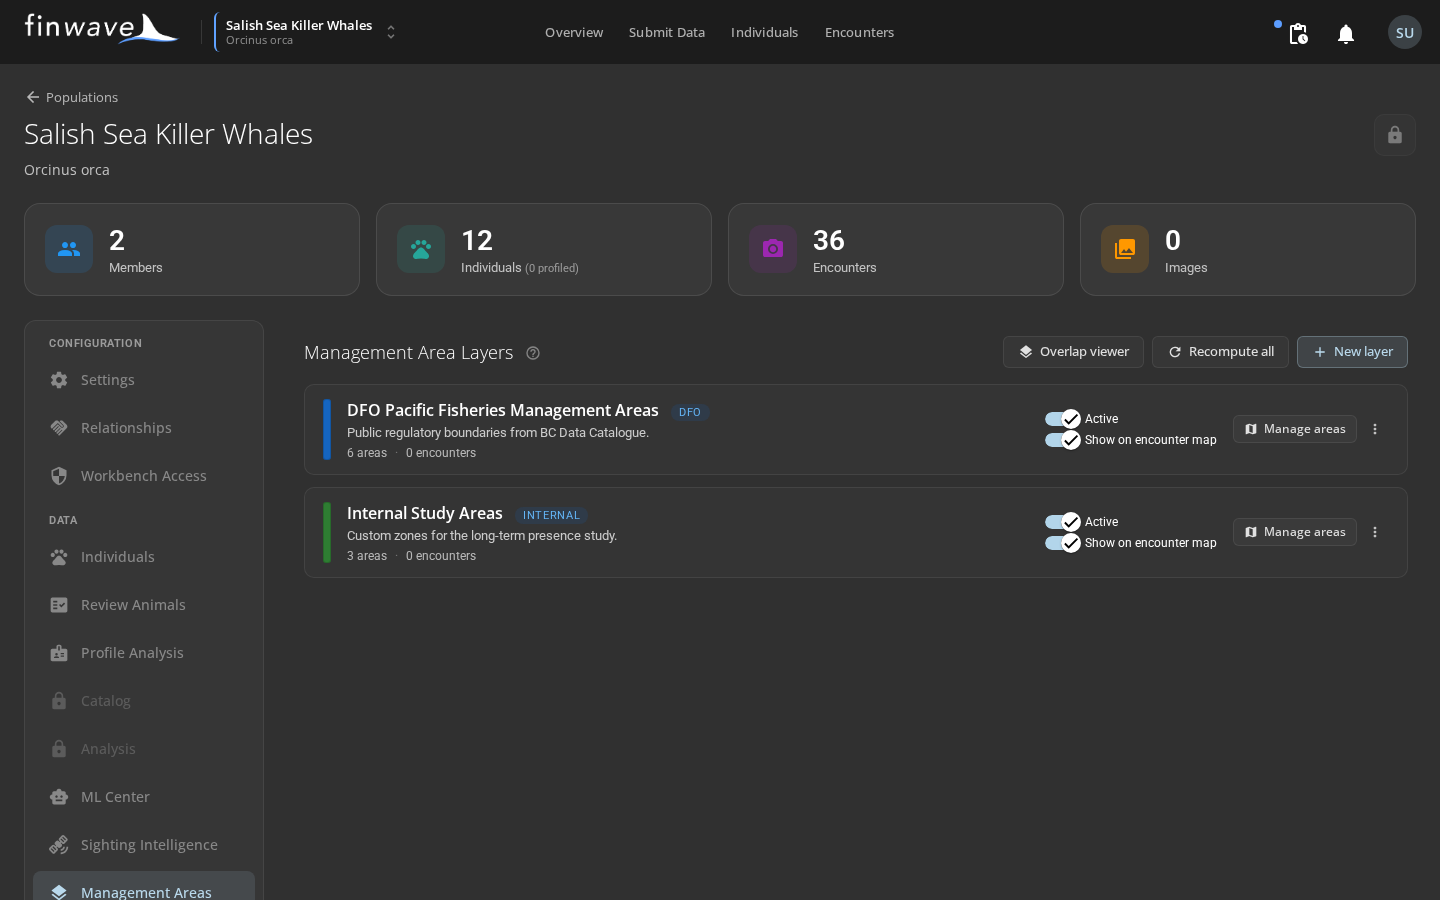
Where to find it
Section titled “Where to find it”In the FinWave web app: open your population’s administration page, then click Management Areas in the left sidebar. The page lists every layer in the population.